Dashboard Instead of Excel: When a Custom Solution Makes Sense
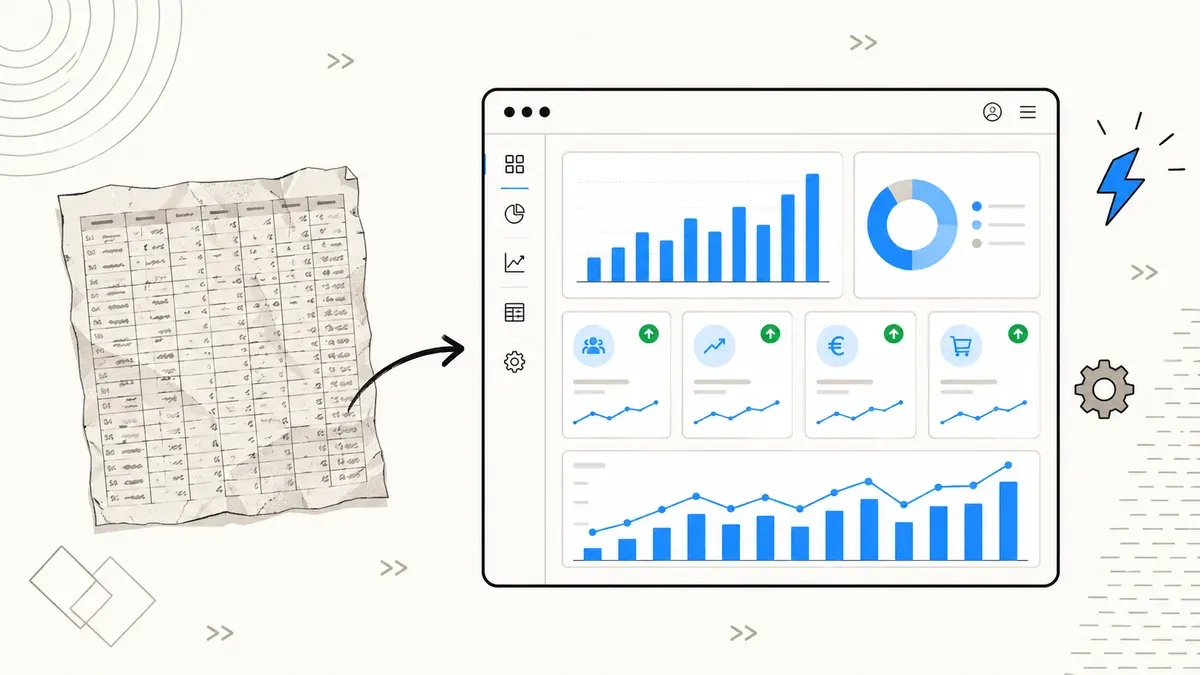
88% of all spreadsheets contain errors, 82% time savings through dashboard automation. When Excel is enough, when SaaS fits, and when you need a custom dashboard – with cost comparison and checklist.
Excel is the most widely used analysis tool in the world. It powers sales reports, inventory tracking, financial planning, project management and client dashboards. And that is exactly the problem: spreadsheets were built for individuals, not for teams, not for real-time data, not for processes with multiple data sources. The moment more than one person works on a file or numbers from different systems need to converge, Excel turns from tool into liability.
88% of all spreadsheets contain at least one formula error. That is not a guess but the result of a long-term study by Ray Panko at the University of Hawaii. 0.9 to 1.8% of all formula cells are incorrect. In a sheet with 2,000 formulas, that is 18 to 36 wrong results. If you make decisions based on that, you are making them on shaky ground. This article shows you when Excel is enough, when you should switch to a dashboard, and what the different options cost.
Your spreadsheet has an
88% error risk
contain at least 1 formula error
dashboard automation
(Forrester TEI, 25-person SMB)
Where Excel Hits Its Limits: 5 Typical SMB Scenarios
Excel works well when one person maintains a manageable dataset and produces a report once a week or month. As soon as one of the following scenarios applies to you, Excel is the wrong choice.
1. Sales pipeline with multiple sources. Your CRM delivers leads, your web tracking delivers conversions, your accounting system delivers revenue. In Excel, that means three exports, manual copy-pasting, formulas across multiple sheets. Every month-end means rework. And when the column order in an export changes, your VLOOKUP formulas break.
2. Inventory and WooCommerce data. You track stock levels in Excel and reconcile them with your store. That works for 50 products. With 500 products including variants, lead times and minimum stock levels, you lose oversight. An automated dashboard that connects directly to your store data shows you in real time which products need reordering.
3. Client reporting. You create monthly reports for clients with metrics from Google Analytics, Google Search Console and ad accounts. Each report means: export data, paste into a template, update charts, save as PDF, send by email. With 10 clients, that is 10 to 15 hours per month. A dashboard that updates automatically reduces this to the time needed for commentary.
4. Financial KPIs with access control. Your CEO needs to see revenue numbers, your sales director the pipeline, your controller the cost structure. In Excel, that means three different files with partially identical data. Or one file with sheet protection that anyone can bypass with a Google search. No audit trail, no versioning.
5. Project time tracking. Employees log hours in a shared Excel file. Version conflicts are daily routine. Whoever saved last overwrites everyone else's entries. Analysis by project, client and time period requires pivot tables that need rebuilding with every structural change.
All these scenarios share one thing: the data exists, but the way it is merged, displayed and shared creates friction. And that friction costs time, accuracy and money.
The Solution Spectrum: From Free to Custom
Between "everything in Excel" and "custom-built dashboard" lies a broad spectrum. Here are the four categories relevant for SMBs:
Free BI tools. Google Looker Studio is free and connects directly with Google Analytics, Google Ads, Google Sheets and BigQuery. For pure marketing dashboards, that is often sufficient. Metabase is open source and self-hosted. You install it on a server (from about $20/month with a hosting provider) and connect it to your database. Metabase outperforms Looker Studio as soon as you have SQL databases as a source.
SaaS BI platforms. Microsoft Power BI starts at $10 per user per month. It integrates seamlessly with the Microsoft ecosystem (Excel, SharePoint, Teams) and offers more visualization options than Looker Studio. For companies already using Microsoft 365, Power BI is often the logical next step.
Low-code platforms. Retool and Appsmith let you build dashboards and internal tools without coding everything from scratch. Retool is free for up to 5 users (team plan: $10/user/month). Appsmith is open source. The advantage: you can not only visualize data but also trigger actions. A button that updates an order in WooCommerce. A form that writes data to your CRM. That is more than a dashboard, those are internal tools.
Custom development. An individual dashboard built with React, Next.js or Vue.js. At DACH agencies, this costs $15,000 to $40,000, often less with specialized freelancers. You get exactly the solution your process needs: the right data sources, the right logic, the right access permissions. No compromises, no feature bloat. More on cost factors for web projects in our cost overview for 2026.
Cost Comparison: 3-Year TCO
Acquisition costs alone tell you little. What matters is the total cost over three years, including time spent on manual work, error correction and maintenance. Here is a realistic scenario for an SMB with 10 users and 5 data sources:
| Cost factor | Excel | SaaS (Power BI) | Custom dashboard |
|---|---|---|---|
| License / development | $0 (included in M365) | $3,600 (10 users x $10 x 36 mo.) | $20,000 (one-time) |
| Manual data work / year | $12,000 (20 hrs/mo x $50) | $2,400 (4 hrs/mo) | $600 (1 hr/mo) |
| Error correction / year | $4,800 (8 hrs/mo) | $600 (1 hr/mo) | $300 (0.5 hrs/mo) |
| Maintenance / updates | $0 | $0 (included in SaaS) | $3,600 ($100/mo) |
| 3-year TCO | $50,400 | $12,600 | $22,700 |
Excel looks free at first glance. But 20 hours of manual data work per month and 8 hours of error correction add up to over $50,000 over three years. SaaS is the cheapest option when standard visualizations and standard connectors are sufficient. Custom becomes economical where the savings in manual time exceed development costs, and in most SMB scenarios, that happens in the second year.
Error Rates and Time Savings
The numbers from the Panko study and Forrester reports make the difference between manual Excel maintenance and automated dashboards measurable:
Error rate by method
Time spent on monthly reports
The 82% time savings do not come from a single step but from eliminating the entire manual chain: export, merge, format, verify, distribute. An automated dashboard handles that in seconds. The remaining time goes into analysis and interpretation, which is where human work creates value.
60% less rework is the second lever. In Excel, you fix broken cell references, corrupted formatting and outdated data. In a dashboard, you fix the data source once, and every view updates automatically.
Checklist: When Is Excel Enough, When Do You Need More?
Not every process needs a dashboard. Excel is still the right tool for many tasks. The question is where the boundary lies. Here is a decision framework:
Excel is enough when:
- You have fewer than 3 data sources
- Only 1 person maintains and analyzes the file
- Reports are static (weekly or monthly, no real-time)
- No access control is needed
- The data structure rarely changes
A SaaS dashboard makes sense when:
- 3 to 5 data sources need to converge
- Fewer than 20 users need access
- Standard visualizations (bars, lines, tables) are sufficient
- Data sources support standard connectors (Google, Microsoft, common APIs)
- No custom workflow is required
A custom dashboard is the right choice when:
- More than 5 data sources need integration
- Role-based access is required (management sees different data than sales)
- Industry-specific logic must be implemented (e.g., stock reach calculations, customer scoring, commission computation)
- Real-time updates are needed
- More than 20 users access the system
- The dashboard should not only display data but also trigger actions (orders, notifications, data updates)
If you are unsure whether your problem is better solved with a custom tool or a SaaS solution, a short conversation usually helps more than weeks of research on your own. We advise on this as part of our custom tools service.
Security: Excel File vs. Dashboard
74% of companies use Excel-based data collection that is neither tamper-proof nor audit-ready (Bitkom). This is not an abstract compliance issue. It means specifically:
- No access control. Whoever has the file sees everything. Excel password protection can be bypassed in seconds. Files get emailed, copied to USB drives, uploaded to personal cloud storage.
- No audit trail. Who changed which value when? In Excel, that is untraceable. For financial or personnel data, this can cause GDPR problems.
- No versioning. "Revenue_report_final_v3_FINAL_new.xlsx" is not a versioning system. Conflicts in shared files lead to data loss.
A dashboard with RBAC (Role-Based Access Control), HTTPS encryption and server-side audit logging solves all three problems. Each user sees only the data relevant to their role. Every change is logged. The data lives on a server instead of in a hundred email attachments. That is not a luxury but baseline for any process containing personal or business-critical data.
If you have problems with data quality in your existing tracking, take a look at our article on common tracking mistakes in SMBs. Clean data at the source is the prerequisite for any dashboard delivering correct results.
Conclusion: The Spreadsheet Is Not the Problem. The Process Is.
Excel is a good tool. It is just the wrong tool for processes with multiple users, multiple data sources and real-time requirements. The Reinhart-Rogoff study of 2013 showed what happens when economic policy decisions are based on a spreadsheet that excluded 25% of countries due to a formula error. In the SMB context, the consequences are smaller, but they add up: wrong order quantities, delayed reports, duplicate data maintenance, security gaps.
The transition does not have to be radical. A Looker Studio dashboard for your marketing reporting costs nothing but setup time. Power BI at $10/user/month is cheaper than the hours you spend on manual data work. And a custom dashboard pays for itself in most cases within 18 to 24 months.
The first step is to map your current Excel processes: Which data comes from where? Who needs which view? Where do the most errors occur? The answers to these three questions show you whether a SaaS solution is sufficient or whether custom development makes sense.
Replace Excel processes with a dashboard?
We analyze your existing data flows and build the dashboard that fits your process. No feature bloat, no compromises.
Free initial consultation →